Award-winning Mapping Inequality project on redlining expanding to more than 200 cities
August 31, 2021
Cloaked in shining armor, institutional racism can echo down the path of human history.
Take redlining, for example.
Amid the Great Depression, the United States created the Home Owners’ Loan Corporation and lauded it as an economic savior. The agency is credited with saving the distressed mortgages of more than 1 million homeowners during the Great Depression.
But the thundering applause drowned out marginalized voices.
The now-defunct government agency worked with real estate developers and bank lenders to code maps of neighborhoods. Areas labeled green had the highest investment potential. Blue meant still desirable. Yellow equaled “in decline.” Then came the areas deemed hazardous for investors: red.
Overwhelmingly, the agency labeled majority-Black neighborhoods as red.
The practice of redlining caused the withholding of capital for Black families and underpinned urban poverty. Ever since, American society has felt the ramifications of this form of institutionalized racial segregation.
A faculty member in the Virginia Tech College of Liberal Arts and Human Sciences is part of an erudite research team dedicated to pinpointing redlined neighborhoods across the nation.
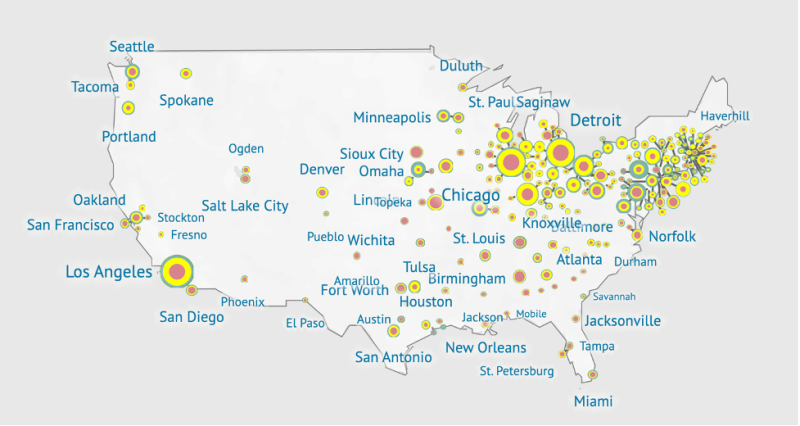
Mapping Inequality: Redlining in New Deal America has served as an online repository of historic maps of 225 U.S. cities since 2016. The acclaimed project offers unprecedented, digitally interactive access to the national collection of the so-called “security maps” and area descriptions that the Home Owners’ Loan Corporation produced between 1935 and 1940.
Community activist groups, U.S. government agencies, news organizations, local government bodies, and scholars have relied on Mapping Inequality to better inform their work.
The project has appeared in a range of media.
The map images were included in acclaimed author Ta-Nehisi Coates’ article "The Case for Reparations."
A map of Los Angeles created through the project was used as a prop in the Samuel L. Jackson and Anthony Mackie film “The Banker,” in which the lead character and an investment partner found white neighborhoods near Black neighborhoods where they might invest and open the neighborhoods and buildings up for Black housing.
Geographic information system maps were used for a study on urban heat islands, which, along with the original redlining map, were featured on the cover of The New York Times in 2020 and in a digital interactive at the same time.
Now, the award-winning project is poised to reach a broader audience.
LaDale Winling, an associate professor in Virginia Tech’s Department of History, and Robert Nelson, director of the Digital Scholarship Lab at the University of Richmond, received a Digital Extension Grant from the American Council of Learned Societies.
The organization awards extension grants with the hope they “will help advance the digital transformation of humanities scholarship by extending the reach of existing digital projects to new communities of users and by adding diversity to the digital record,” according to its website.
Winling, Nelson, and their colleagues will use the grant funds for the following additions:
- More maps and elusive documents to expand the geographic reach;
- New visualization tools to make the site’s important textual resources more accessible;
- Approximately 250 city-specific contextual essays from scholars who use the site to provide closer attention to the connection between the national and the local; and
- New curricular materials to expand the project’s reach in secondary schools and universities.
Mapping Inequality launched through a partnership among Virginia Tech, Johns Hopkins University, the University of Maryland, and the University of Richmond.
“By creating this valuable online resource, we sought to shine a light on the historical role of racial discrimination in the U.S. housing sector,” said Winling, who is writing a book centered on redlining. “We are pleased to see the various ways organizations and individuals have used these maps to make sense of historical data and inform discussions on race and urban inequalities. With the generous support of the American Council of Learned Societies, we hope to continue increasing access to these historical maps.”
Winling said he looks forward to engaging with more scholars to produce essays about the effect of redlining in smaller cities and towns.
“The Home Owners’ Loan Corporation mapped more than 200 cities,” Winling said. “It’s not enough to just tell the history of redlining in Philadelphia. Gaining a better understanding of the ways redlining impacted and continues to impact smaller cities is important for those communities and society as a whole.”
A major piece of this new phase of the Mapping Inequality project involves collaborating with more than 200 scholars, Winling added.
The project team will commission the researchers to write essays telling the story of redlining in each individual community. The scholars will use Mapping Inequality maps as a primary source while gathering local historical data.
Winling said the team also looks forward to engaging more closely with school systems through the grant. In addition to requests from news outlets, the Mapping Inequality team often fields questions from educators hoping to use the project as a teaching tool.
“This mapping project casts in sharp relief racially discriminatory real estate practices from the 1930s that were so impactful that we can still see their effects today in 21st-century inequalities of wealth, health, and the environment,” said Nelson, Winling’s University of Richmond collaborator. “We’re grateful that Mapping Inequality is being used so widely by policymakers, journalists, scholars, students, and citizens as they reckon with this history.”
Anyone interested in exploring Mapping Inequality data can visit the project website by following this link.
Written by Andrew Adkins